
26 Jul Body Logic™ DXA Scan Whole Body Composition
BodyFusion™ DXA scan is state-of-the-art method to assess body composition. The low dose e-ray scan is the gold standard to assess:bone density, lean mass and fat mass.
This Advanced Body Composition® Assessment helps determine a good treatment plans and training programs for patient or athlete. In addition it helps monitor and enhance patients’ weight loss and weight management programs.
How safe is DXA technology? DXA radiation is less than flying from LAX to NYC. Now lets take a look at obesity trends among adults in the US.
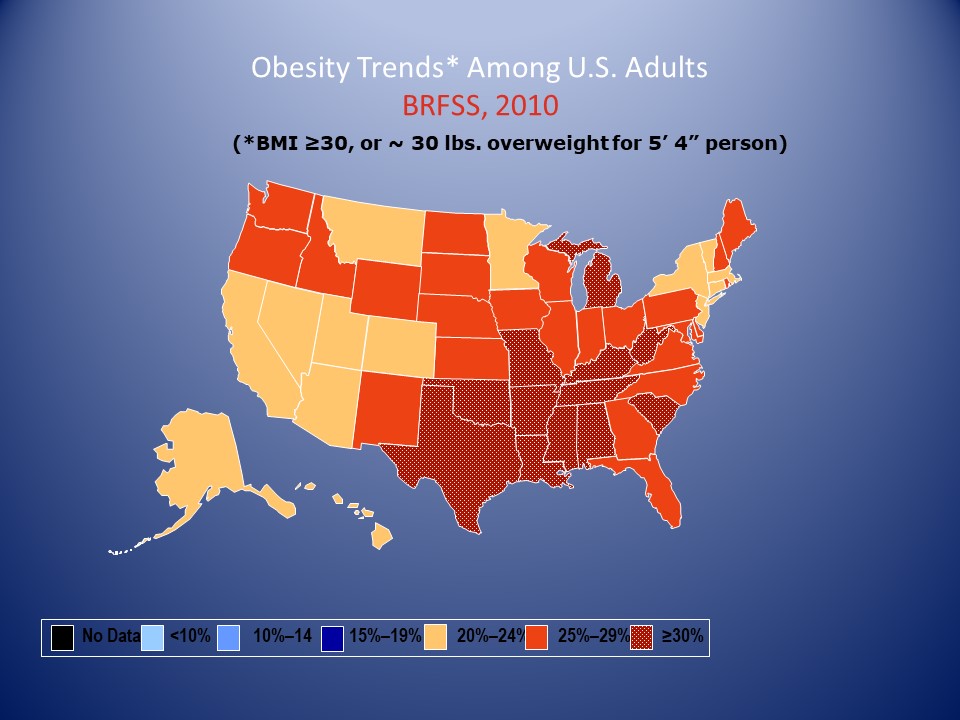
In 1990, among states participating in the Behavioral Risk Factor Surveillance System, 10 states had a prevalence of obesity less than 10% and no state had prevalence equal to or greater than 15%.
By 2000, no state had a prevalence of obesity less than 10%, 23 states had a prevalence between 20–24%, and no state had prevalence equal to or greater than 25%.
In 2010, no state had a prevalence of obesity less than 20%. Thirty-six states had a prevalence equal to or greater than 25%; 12 of these states (Alabama, Arkansas, Kentucky, Louisiana, Michigan, Mississippi, Missouri, Oklahoma, South Carolina, Tennessee, Texas, and West Virginia) had a prevalence equal to or greater than 30%.


Body Mass Index (BMI)
- BMI: Body weight (kg)/Ht (m²) = kg/m²
- Limitations:
- Measures excess weight, not excess fat
- Not gender specific
Fat Mass Index (FMI) = Fat mass (kg)/Ht (m²)
- Accurate assessment of fat mass
- Gender specific
Bone Density
- First use of DXA technology was measuring bone strength
- The technology then evolved into measuring fat and lean mass

- Until 2008 there was no accurate reference data for percent body fat and muscle mass
- In 2008 the CDC compiled first accurate body composition data (NHANES)
- In 2011 Hologic was first DXA system to incorporate NHANES data

- Color Map
- BMI vs FMI
- Graph comparison to general population
- Specific regions FMI
- Lean Indices
- Specific comparison to general population

- Color Map
- % Fat Trending
- Compartmental trending
- Change in percentiles
- Most accurate measurement of abdominal adipose tissue
- Only accomplished by DXA technology
- Possibly more significant than CTCS in assessing risk of CAD
- Heart attack and stroke occur from plaque rupture, not occlusion
- Stable plaque– contains calcium and unlikely to rupture
- Unstable plaque– metabolically active and more likely to rupture
- CT Calcium Score (CTCS) measures plaque burden noninvasively, but only measures stable plaque
- Gold standard of measuring plaque burden is CT angiogram (CTCA) but is very invasive
- VAT assessment is more strongly associated with progression of non-calcified plaque than BMI or waist circumference


- BMR (Basal Metabolic Rate)–estimate of minimal calories needed to maintain basic bodily functions
- REE (Resting Energy Expenditure)– estimate of energy cost to maintain the body in steady state conditions.
- REE is underestimated in majority of athletes due to high FFM (Free Fat Mass)
- REE predictive equations are considered population specific, i.e. relatively high FFM
- Gold standard is indirect calorimetry
- Expensive
- Not readily available
- Need specialty trained personnel for consistent results
- Predictive equations are most often used to estimate the REE
- De Lorenzo and Cunningham equations are most commonly used
- De Lorenzo equation is based on elite athletes and does not accurately predict REE for recreational athletes
- Cunningham equation is based on lean body weight , the FFM, in the general population
- Accurate FFM can only be obtained with DXA technology
Original Cunningham Equation:
REE (kJ/d) = 49.940*wt (kg) + 2459.053*ht (m) – 34.014*age (yr) + 799.257*sex (1 m, 0 f) + 122.502
Revised Cunningham Equation:
REE (Kcal/d) = 500 + {22 x FFM (kg)}
BMR and Weight Loss
Weight Loss Goal: 1 lb/week
- 1 lb = 3,500 kcal
- To lose 1 lb/wk, then calorie restriction would be 3,500 kcal/7 days or
- 500 kcal per day restriction below BMR
 = 1,949 Kcal/d")
 = 1,949 Kcal/d")